It happened.
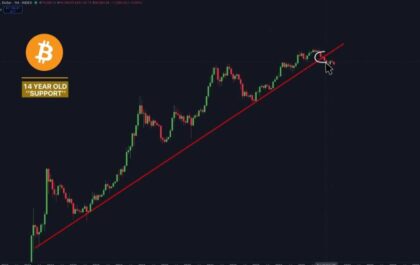
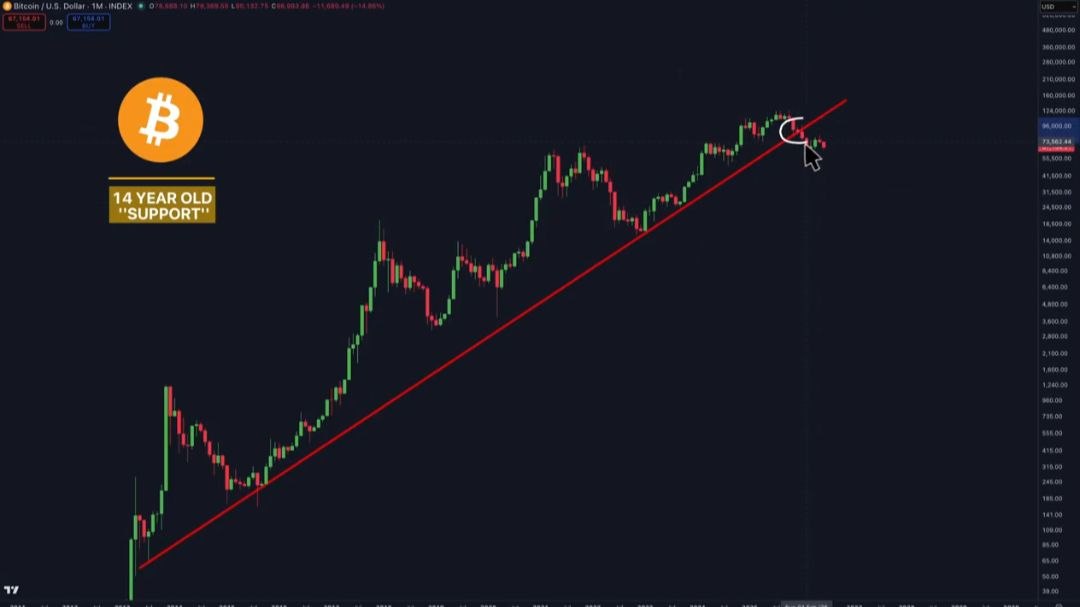
The trendline that has held Bitcoin together for 14 years just broke. This isn’t some random moving average. This is the diagonal that connected every single market cycle low since 2012.
Mt. Gox collapsed — trendline held.
The 2018 crypto winter killed 90% of the market — trendline held.
COVID flash-crashed Bitcoin to $3,600 — trendline held.
FTX obliterated trust in the entire space — trendline held.
And now? After all that, Bitcoin is trading below it.
What Does This Actually Mean?
In technical analysis, breaking a 14-year support line is catastrophic. It means the macro structure that defined Bitcoin’s entire bull market trajectory is no longer intact. If this support fails to reclaim, the next stop isn’t $60K. It’s not $50K. It’s $30K — where the next major support level sits.
The people who tell you “hodl and ignore the charts” are the same people who bought at $69K and watched their portfolio get cut in half. Twice.
This is not a drill. This is the most significant technical event in Bitcoin since the 2021 all-time high.
Either this support line gets reclaimed in the coming weeks, or we are looking at a bear market that makes 2018 and 2022 look like a warm-up.
What’s your take? Dead cat bounce or start of something worse? Drop your chart analysis below.